
RP-101: The Complete FX Volatility Predictability Surface
How predictability degrades from 1 hour to 24 hours, where the session-length anomalies are, and what the feature importance evolution reveals about FX market microstructure

Abstract
CENTRAL FINDING
FX volatility is predictable at every horizon from 1 hour to 24 hours, and the shape of that predictability reveals the internal clock of the FX market. We train 24 identical LightGBM models — one per integer hour — on 2.7 million hourly observations spanning 28 currency pairs and 18 years. The resulting predictability surface reveals four distinct zones, a feature dominance rotation from microstructure to macro regime, and two session-length anomalies that directly reflect institutional trading patterns.
KEY FINDINGS
1. Peak predictability occurs at 4 hours, not 1 hour. The 4h model achieves the highest OOF AUC (0.766), surpassing both the 1h model (0.734) and every other horizon. This is counterintuitive and structural: four hours captures the full arc of a major FX trading session — opening liquidity, mid-session price discovery, closing flows. The model learns to predict the shape of a session, not just current conditions.
2. The surface has four distinct zones. Zone 1 (1–4h): strong signal, session-driven, AUC 0.73–0.77. Zone 2 (5–8h): moderate decline, session-handoff effects, AUC 0.73–0.75. Zone 3 (9–16h): plateau, AUC ~0.725, remarkably stable across eight consecutive horizons. Zone 4 (17–24h): gradual macro-regime decline, AUC 0.69–0.72.
3. Predictability never falls below AUC 0.69. Even at 24 hours, the model discriminates between high-vol and low-vol periods meaningfully above chance. Test AUC (0.715) exceeds OOF AUC (0.693) at 24h, driven by calendar-signal strength in the 2024–2026 test period.
4. Feature dominance rotates completely across the surface. At 1h, recent return momentum (importance 689) dominates. By 6h, days-to-month-end enters the top 5. By 12h, it is the top feature. By 24h, it leads by a factor of 2x (importance 509 vs 295 for the second feature). These are not the same signal at different resolutions — each zone accesses a genuinely different information source.
5. The 9–16h plateau is the most unexpected finding. Eight consecutive horizons produce nearly identical AUC (0.709–0.734 OOF, 0.725–0.728 test). This stability suggests a persistent information regime — possibly the 24-hour global session cycle — where the same features maintain constant predictive power regardless of exact forecast horizon.
6. Test AUC meets or exceeds OOF AUC at all 24 horizons. No overfitting. The divergence grows progressively from +0.017 at 1h to +0.023 at 24h, reflecting stronger calendar effects in the 2024–2026 test period.
1. Introduction
The question of whether financial market volatility is predictable has been settled in the academic literature: it is. GARCH models, realized volatility estimators, and machine learning approaches have all demonstrated out-of-sample predictive power for equity and FX volatility. What remains poorly understood is the structure of that predictability across forecast horizons.
Most volatility research picks a single horizon — daily is the default — trains a model, reports an AUC or R-squared, and moves on. This leaves a fundamental question unanswered: how does predictive power change as the forecast window lengthens from one hour to one day? Does it decay monotonically? Does it collapse at some threshold? Does it exhibit structure that reveals something about how markets process information?
This report answers these questions for FX markets with full hourly granularity. We train 24 identical models — one per integer hour from 1h through 24h — using the same 98 features, the same LightGBM architecture, and the same walk-forward validation protocol. The result is not a single number but a complete surface: a map of where, when, and how volatility predictability exists in foreign exchange, at every hour of the trading day.
The findings have both academic and practical significance. Academically, the four-zone structure and feature rotation provide new evidence about information processing timescales in FX. Practically, the surface tells traders and systematic strategies exactly which horizons offer the most reliable edge, why, and how confidence should decay as the forecast window extends.
Note on report numbering: RP-101 begins a separate series from the SSI characterization reports (RP-001 through RP-012). RP-001 characterized the statistical properties of retail positioning data. RP-003 documented session-based volatility structure. RP-101 builds on both by asking whether volatility can be predicted across horizons, and what the structure of that predictability reveals.
2. Data and Methodology
2.1 Dataset
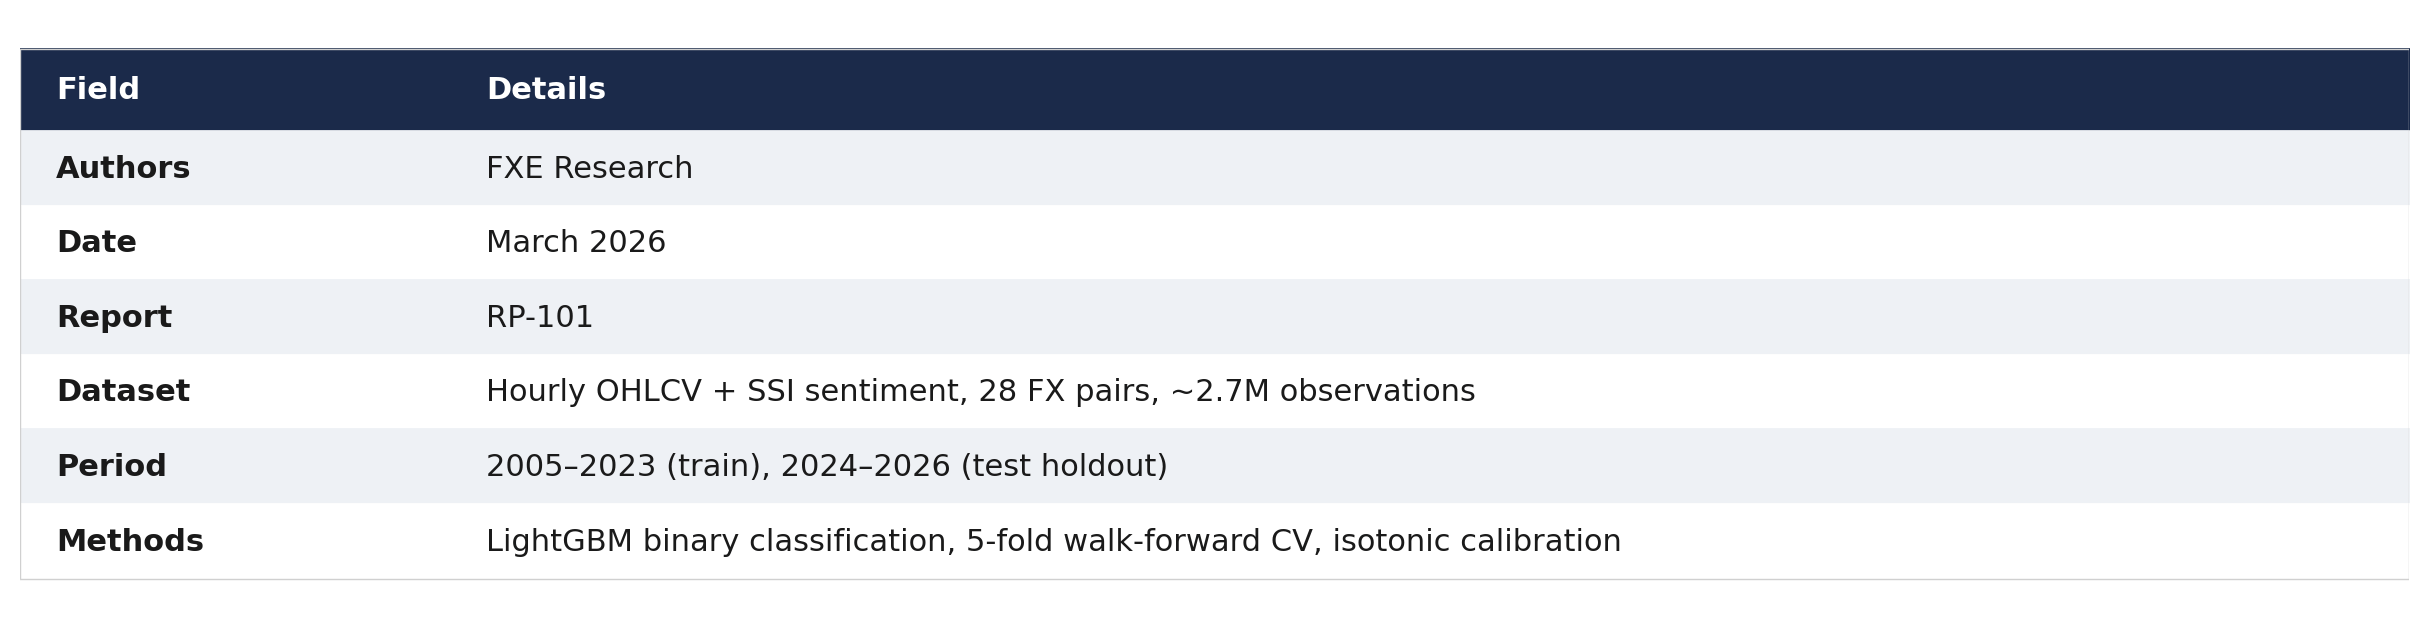
The primary dataset consists of hourly OHLCV price data for 28 currency pairs spanning January 2005 through March 2026: 7 major pairs (EURUSD, GBPUSD, USDJPY, USDCHF, AUDUSD, USDCAD, NZDUSD) and 21 cross pairs covering all combinations of EUR, GBP, AUD, NZD, CAD, CHF, and JPY. Total observations: approximately 2.7 million hourly rows across all pairs.
Supplemental features include FXCM Speculative Sentiment Index (SSI) data for 16 sentiment-derived features. The model handles missing sentiment data natively via LightGBM's NaN support, with less than 0.02 AUC degradation on pairs or periods where SSI is unavailable.
2.2 Target Variable
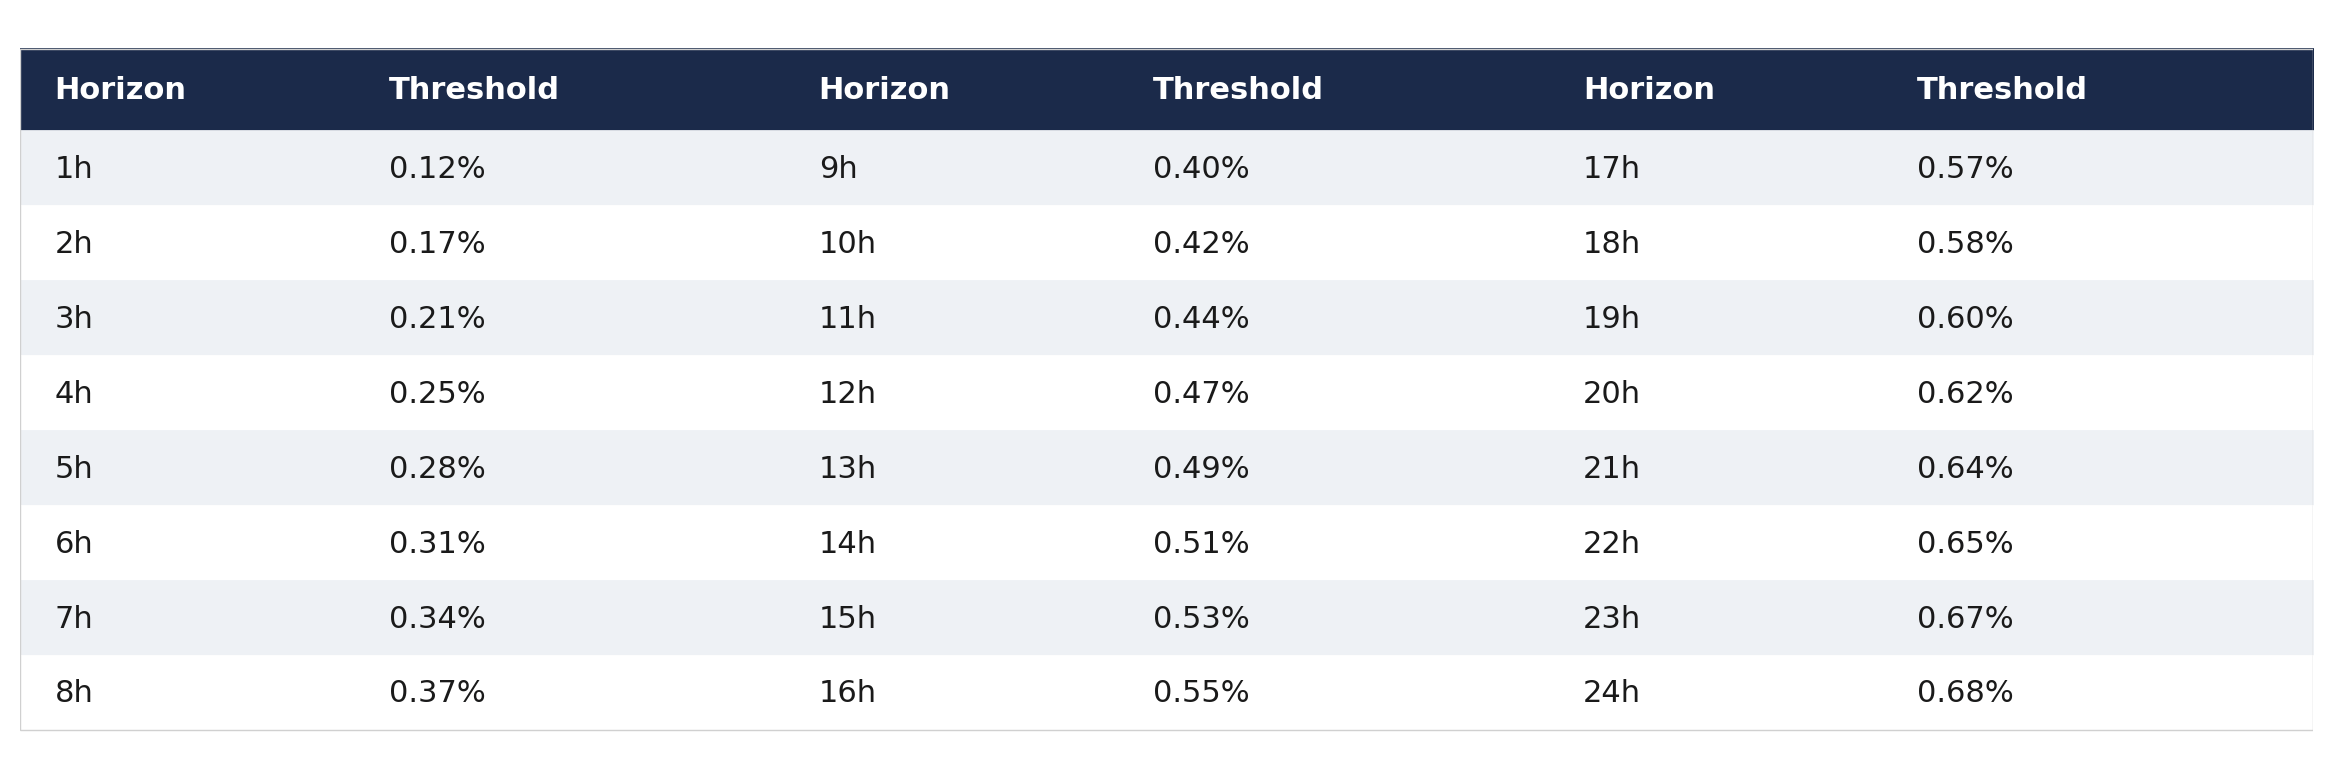
For each horizon H (1 through 24 hours), the target is binary: Label = 1 if |forward_return_over_H_hours| > threshold, Label = 0 otherwise. Forward returns are computed row-based (market hours), not calendar-based. Weekend gaps are naturally skipped, matching how institutional traders experience time.
Thresholds are calibrated per horizon to produce a consistent ~17.5% base rate:
2.3 Feature Engineering (98 Features)
All 24 models use identical features computed at time T from data available at or before the forecast timestamp. There is no forward-looking information leakage.
Volatility state (14): Realized volatility at 5 lookback windows, ATR at 4 windows, vol-of-vol at 2 windows, 2 vol regime ratios. Price action (25): Returns at 9 horizons, trend indicators at 6 windows, z-scores, range measures. Technical indicators (10): RSI, MACD, Bollinger Band width and position, MA distance. Calendar effects (10): Hour-of-day (sine/cosine encoded), day-of-week, month, London/New York/Asian session flags, days to month-end. Volume and liquidity (14): Log volume, ratios, z-scores, ROC, spread and spread z-score. Sentiment (16, optional): SSI level, z-scores, rate-of-change, acceleration, divergence indicators. Up/down ratio (2): Fraction of up-candles over 24h and 5d windows.
2.4 Model Architecture
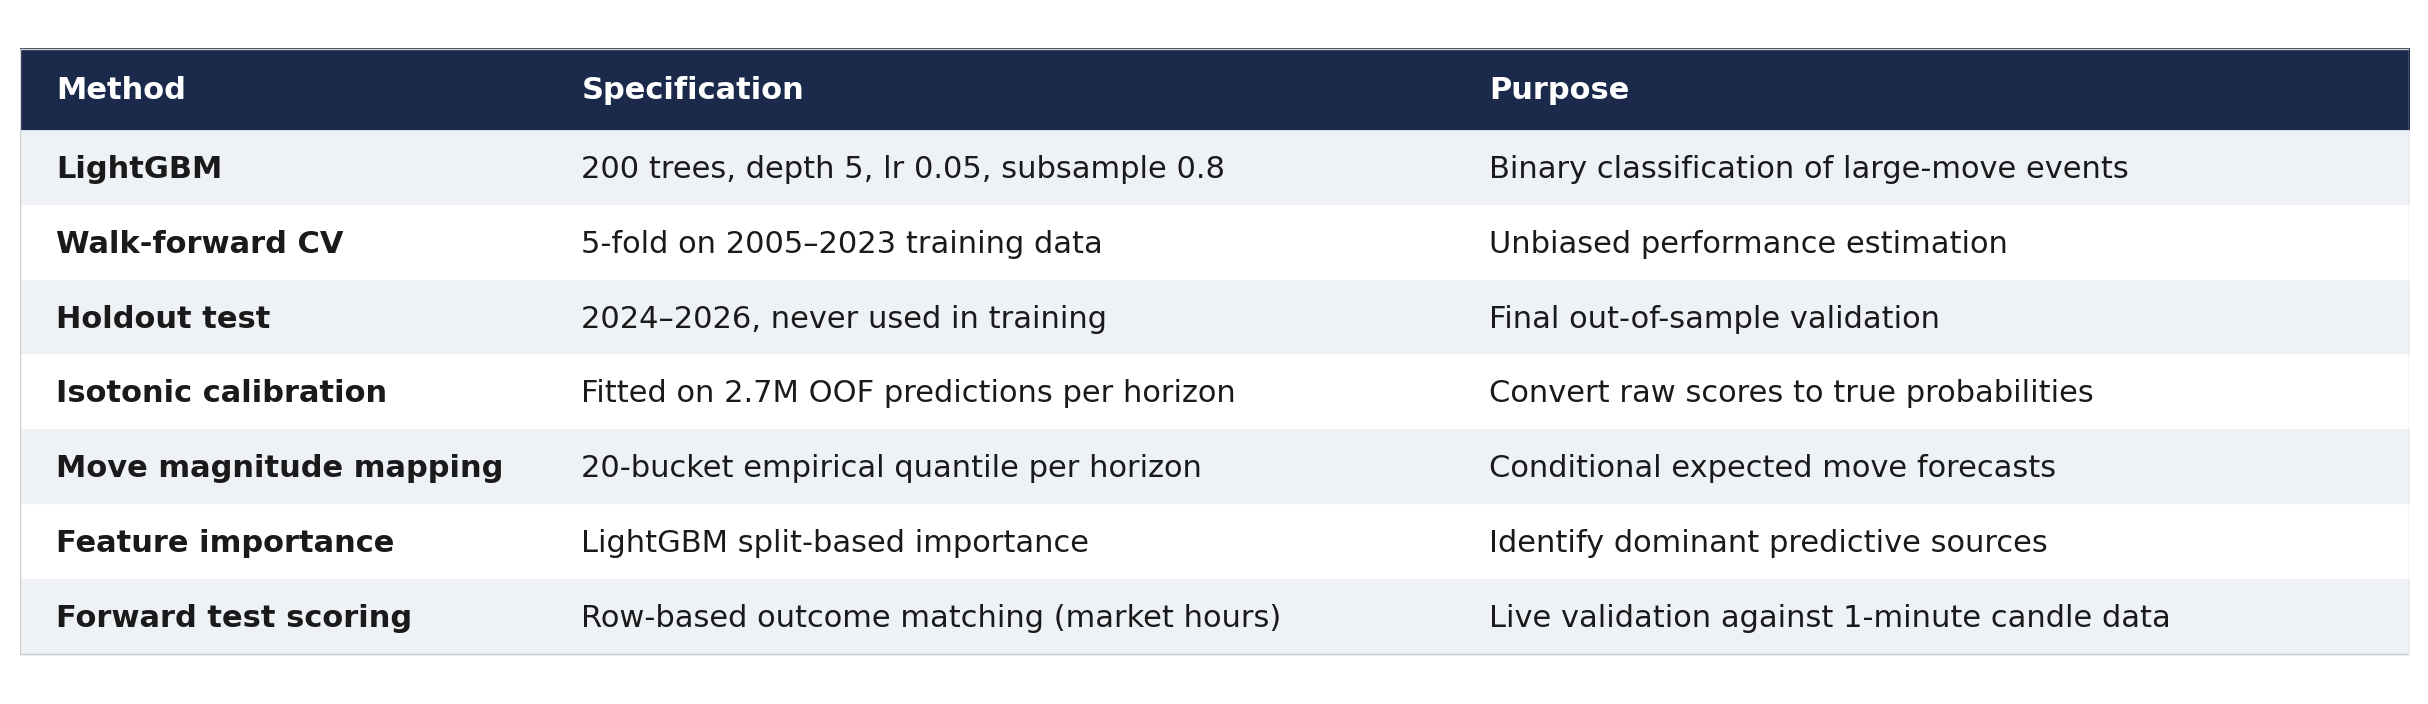
All 24 horizons use the same LightGBM configuration: 200 trees, max depth 5, learning rate 0.05, 80% row and column subsampling, minimum 50 observations per leaf. Hyperparameters were not optimized per horizon. The only parameter that changes across the surface is the target variable definition.
Alternative Architecture: Single Multi-Horizon Model
We tested whether a single LightGBM model — trained on all horizons simultaneously with horizon_hours as an additional input feature — could replace 24 dedicated models. The result: it cannot, and the reason why is informative.
In the single model, horizon_hours became the dominant feature by a wide margin (importance 542, nearly double the #2 feature). The model learned to predict the degradation curve itself rather than the genuine per-horizon signal. This shortcut produced a systematic performance penalty at exactly the endpoints that matter most: the 1h model lost 1.4pp AUC, and the 24h model lost 1.1pp AUC. The plateau zone (9–16h) gained modestly (+0.5 to +1.7pp), but those are the horizons with the most redundant coverage in the product surface.
The performance loss at 1h and 24h is not coincidental. These are the horizons with the most distinct feature regimes — microstructure at 1h, macro calendar at 24h. When the model must serve both simultaneously, it loses the ability to specialize. The feature importance rotation documented in Section 4 is real and requires dedicated models to exploit fully.
Decision: 24 dedicated models. The experiment is archived.
2.5 Walk-Forward Validation
Training period: 2005–2023 (18 years). 5-fold walk-forward cross-validation within the training period. Test holdout: 2024–2026, never used during training or hyperparameter selection. Out-of-fold (OOF) predictions used to fit isotonic calibration and move magnitude mapping per horizon.
2.6 Horizon Coverage: Training vs. Production
This report analyzes all 24 integer-hour models. The production forecasting system deploys a subset of 8 horizons (1h, 2h, 3h, 4h, 6h, 8h, 12h, 24h), selected for operational relevance and to avoid redundancy between adjacent horizons. The remaining 16 models were trained for research purposes — to map the complete predictability surface — and are not deployed in the live system.
All 24 models use identical architecture, features, and validation methodology. Results for non-production horizons should be interpreted as research findings about the structure of predictability, not as claims about deployed system performance.
3. The Complete Predictability Surface
3.1 AUC Across All 24 Horizons
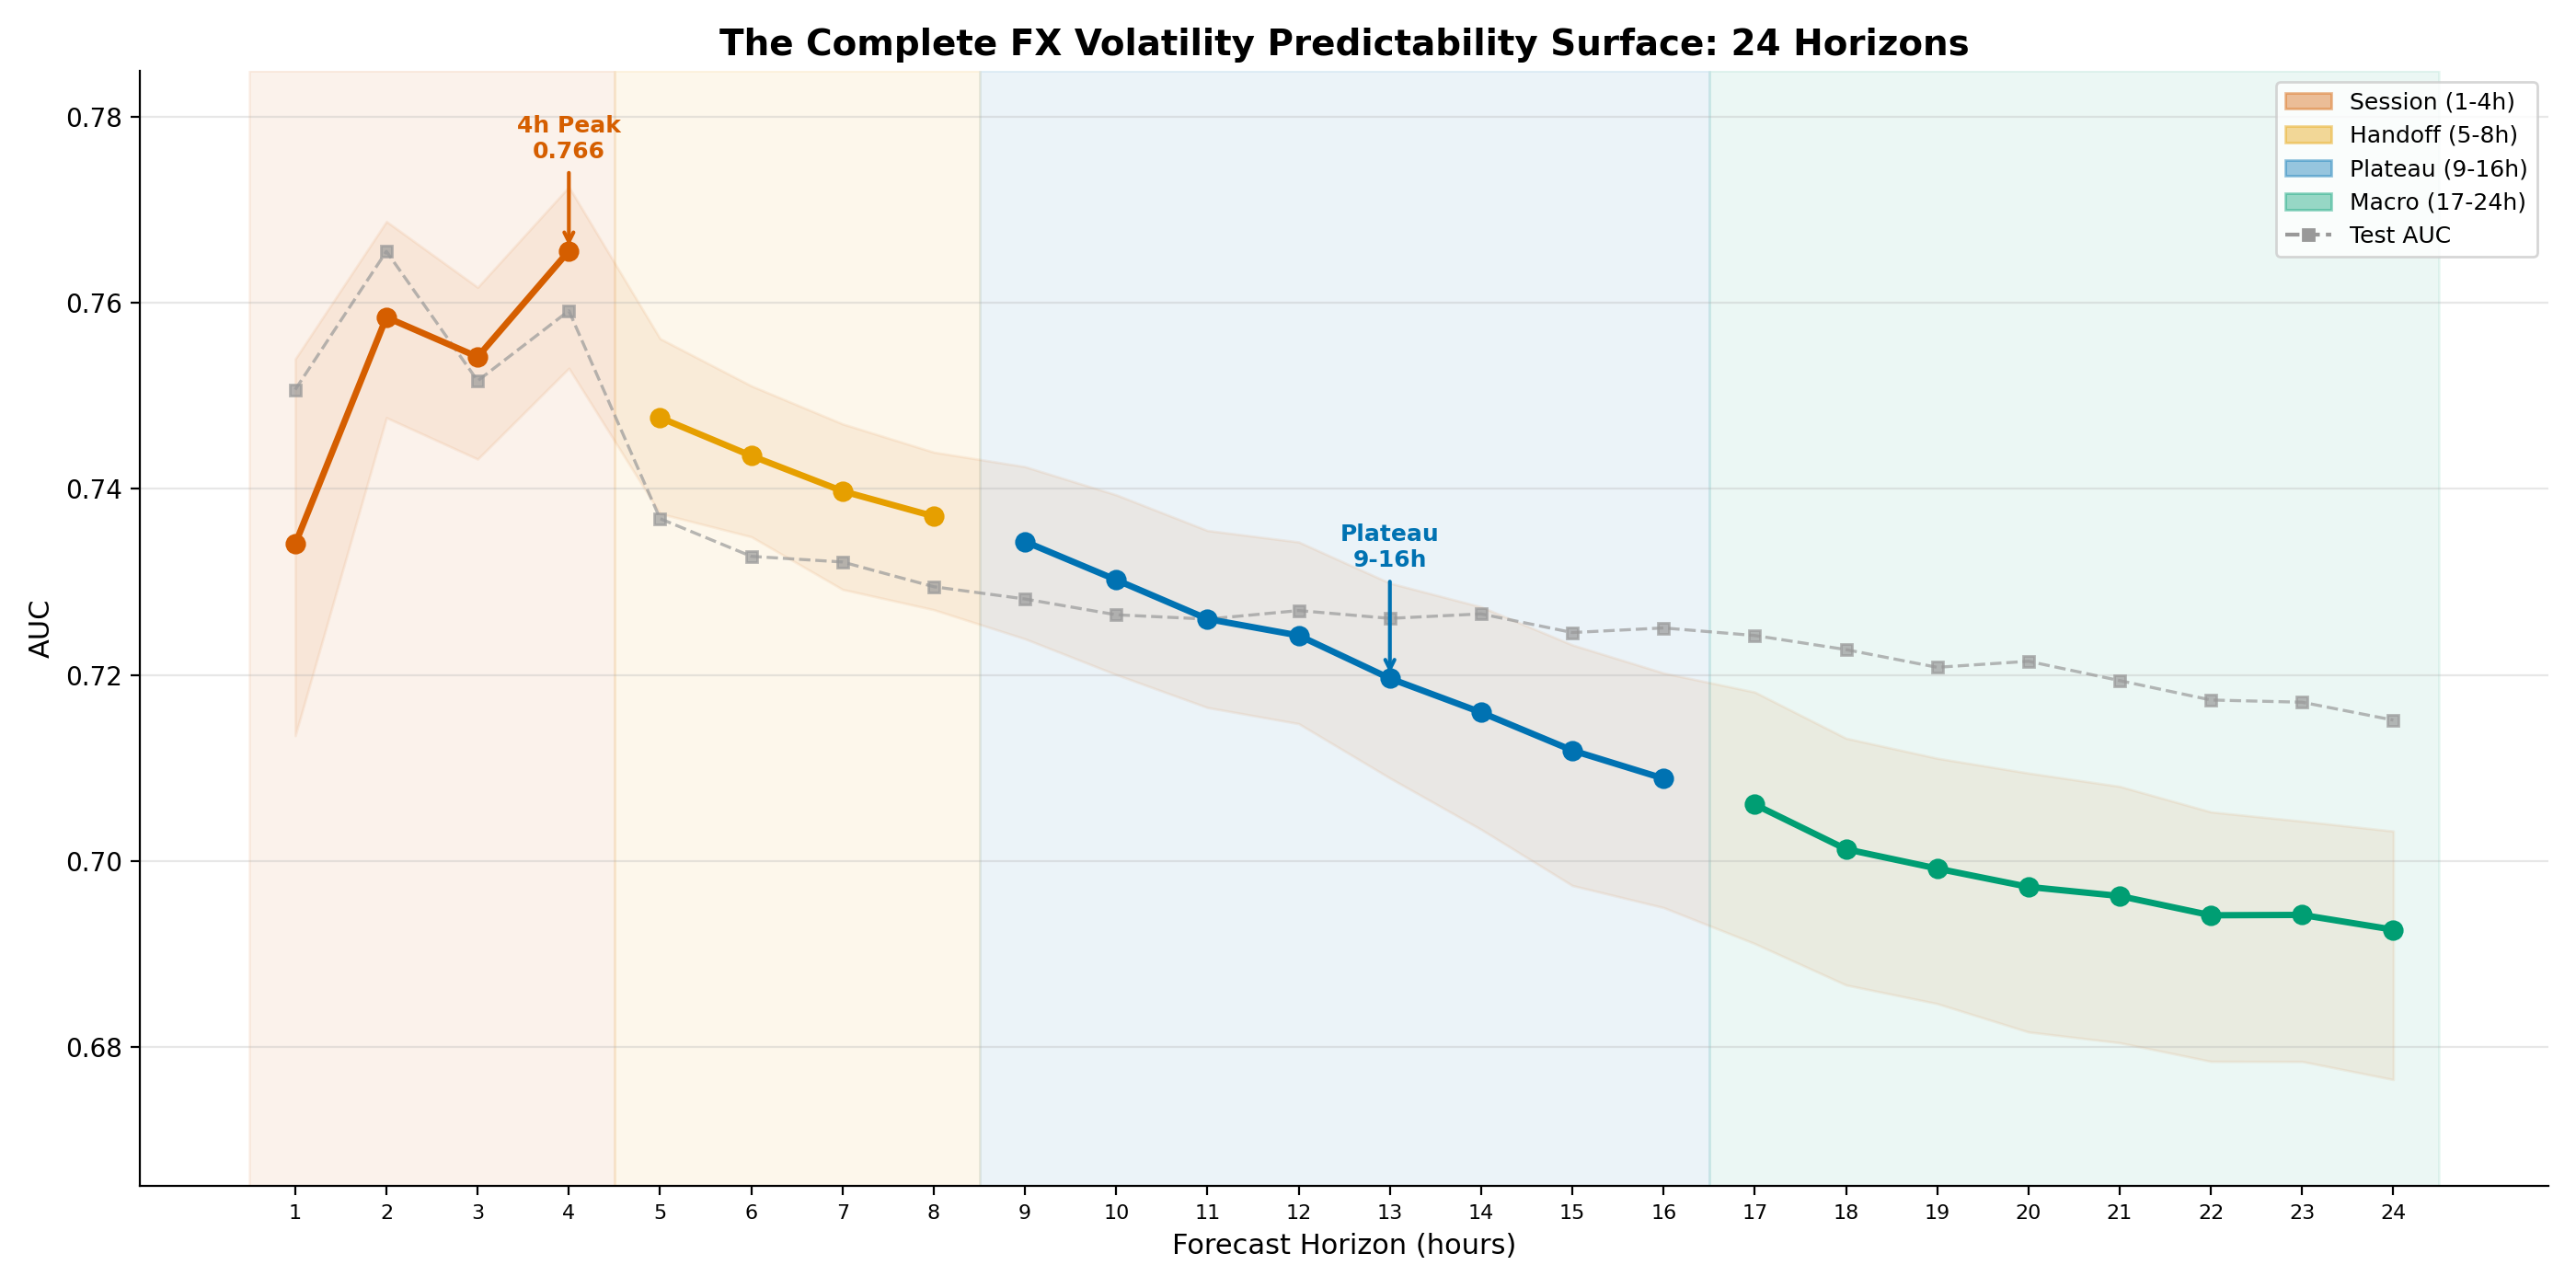
Figure 1: The complete FX volatility predictability surface across 24 hourly horizons. Four distinct zones are visible: Session (1–4h, orange), Handoff (5–8h, yellow), Plateau (9–16h, blue), and Macro (17–24h, green). The 4h peak (OOF AUC 0.766) and the 9–16h plateau are the two structural findings that depart from a simple monotonic degradation model. Test AUC (grey dashed) meets or exceeds OOF AUC at all horizons.
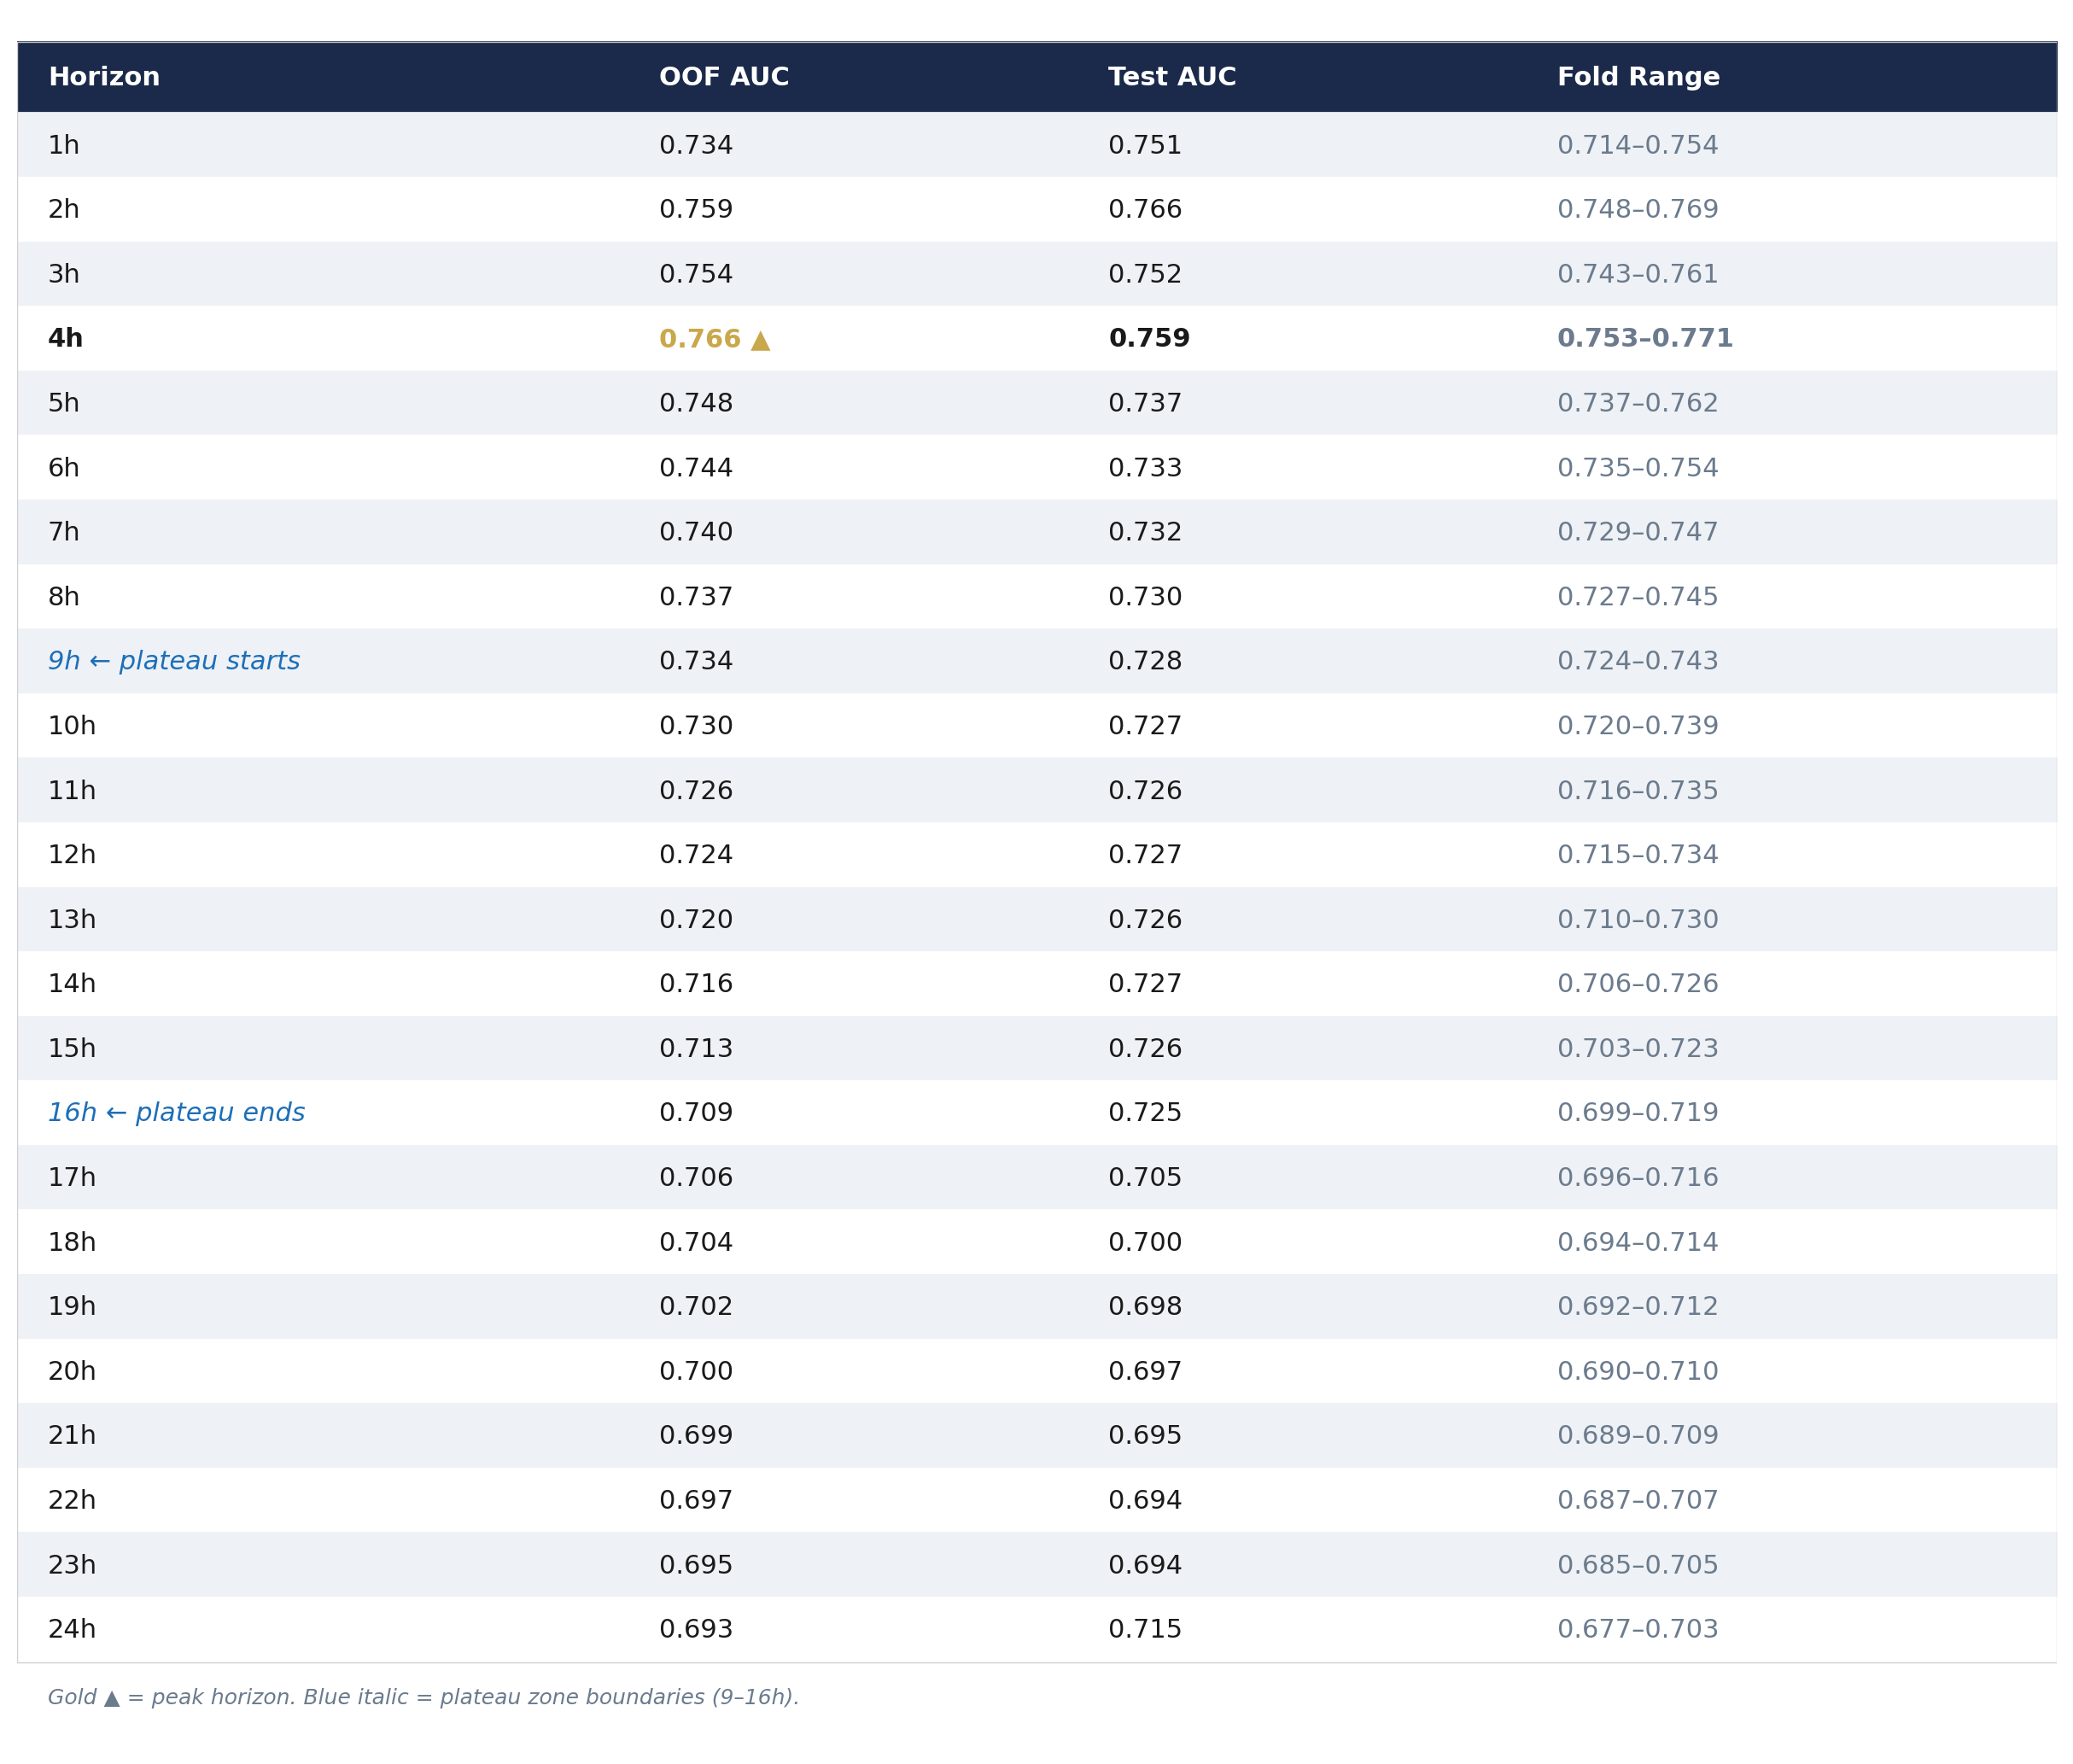
Every horizon above 0.69 OOF AUC. No horizon below meaningful discrimination. FX volatility is predictable across the entire surface.
3.2 The Four-Zone Structure
The surface does not decay monotonically. It has structure — four distinct zones that correspond to known features of FX market organization:
Zone 1: Session (1–4h, OOF AUC 0.73–0.77). The strongest predictive zone. The 4h peak reflects the full arc of a major trading session. Predictability rises from 1h to 4h before declining — the model gains power as it can see more of the session structure.
Zone 2: Handoff (5–8h, OOF AUC 0.73–0.75). A moderate decline phase corresponding to the London-to-New York session transition. The 5h cliff (–0.018 OOF AUC from 4h to 5h) is the sharpest single-step decline on the surface and marks the exact point where a single-session forecast becomes a cross-session forecast.
Zone 3: Plateau (9–16h, OOF AUC 0.709–0.734). The most unexpected finding. Eight consecutive horizons at nearly identical AUC. Section 6.3 explores the hypothesis that this reflects a transition from intraday to overnight regime prediction.
Zone 4: Macro (17–24h, OOF AUC 0.69–0.71). Gradual decline as calendar and vol-regime features become the dominant signal. The 24h test AUC (0.715) significantly exceeds OOF (0.693), suggesting the 2024–2026 calendar effects were particularly strong.
4. Feature Importance Evolution
4.1 The Four-Zone Feature Rotation
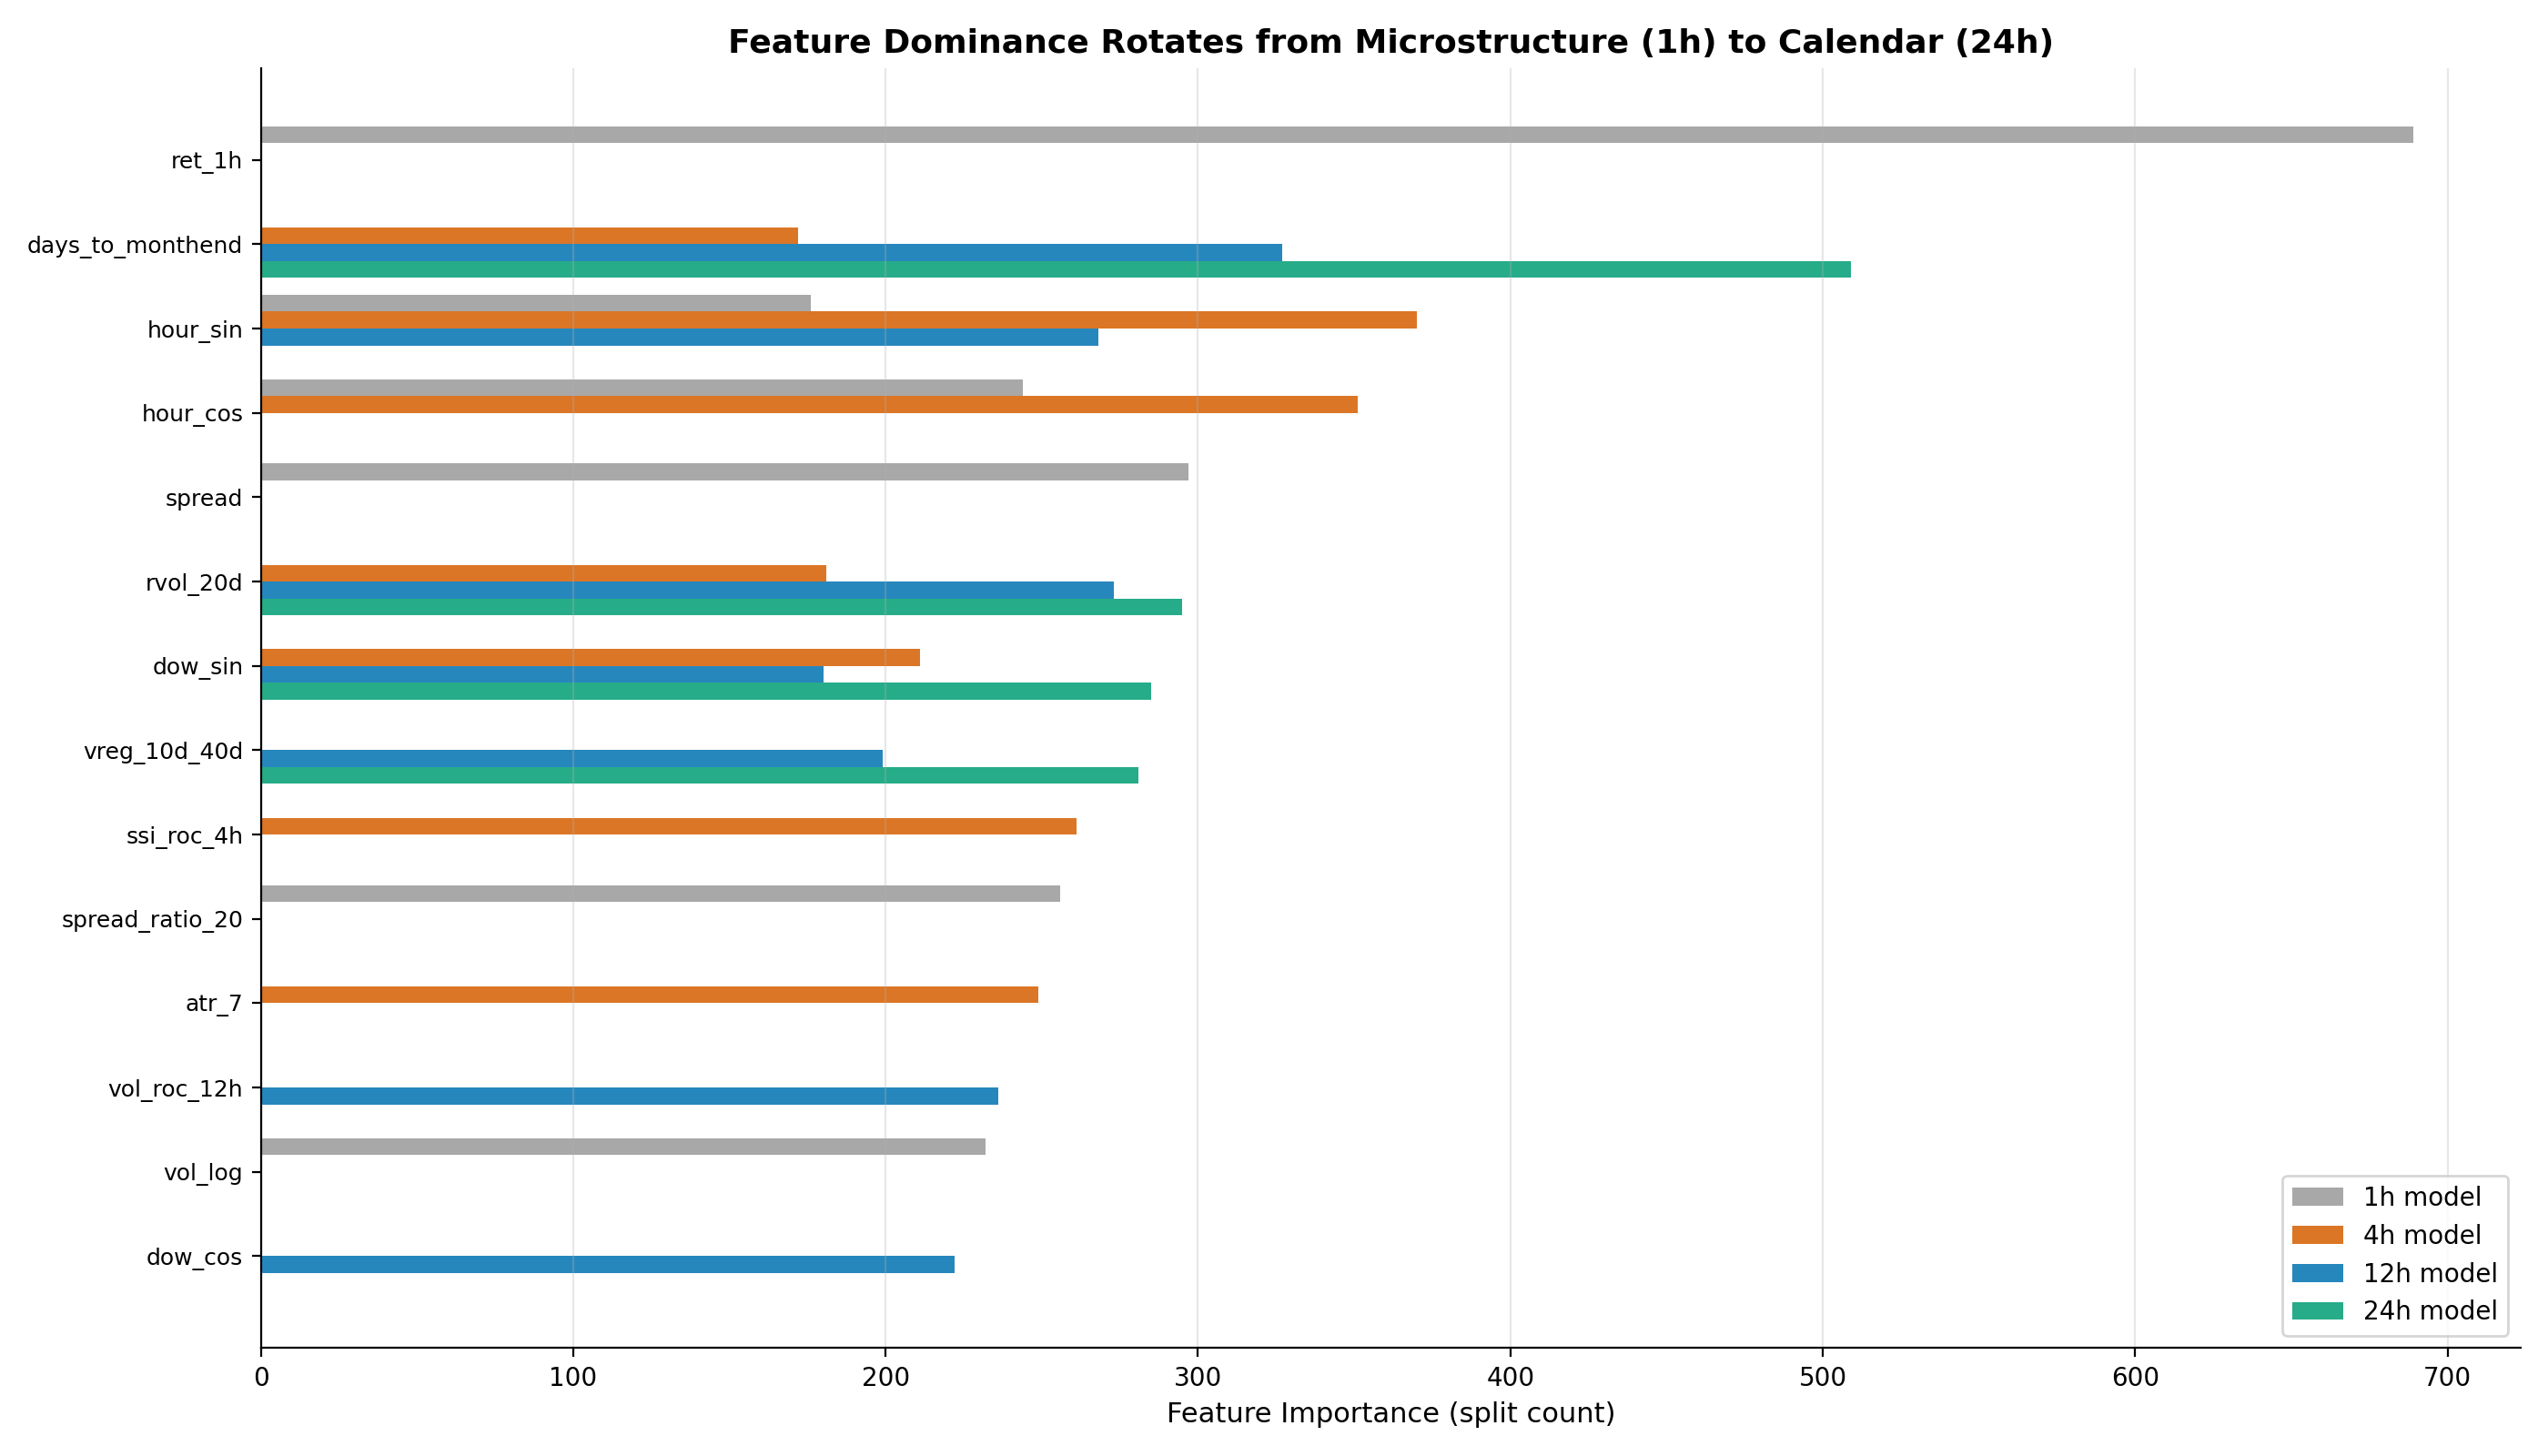
Figure 2: Feature dominance rotates from microstructure at 1h to calendar effects at 24h. The ret_1h bar (grey, 1h model, importance 689) is the most dominant single feature at any horizon. The days_to_monthend bar (teal, 24h model, importance 509) dominates at the longest horizon. The ssi_roc_4h bar (orange, 4h model) appears only for the 4h model — SSI sentiment is a session-timescale signal, not a microstructure or macro signal.
1-Hour Model — Microstructure
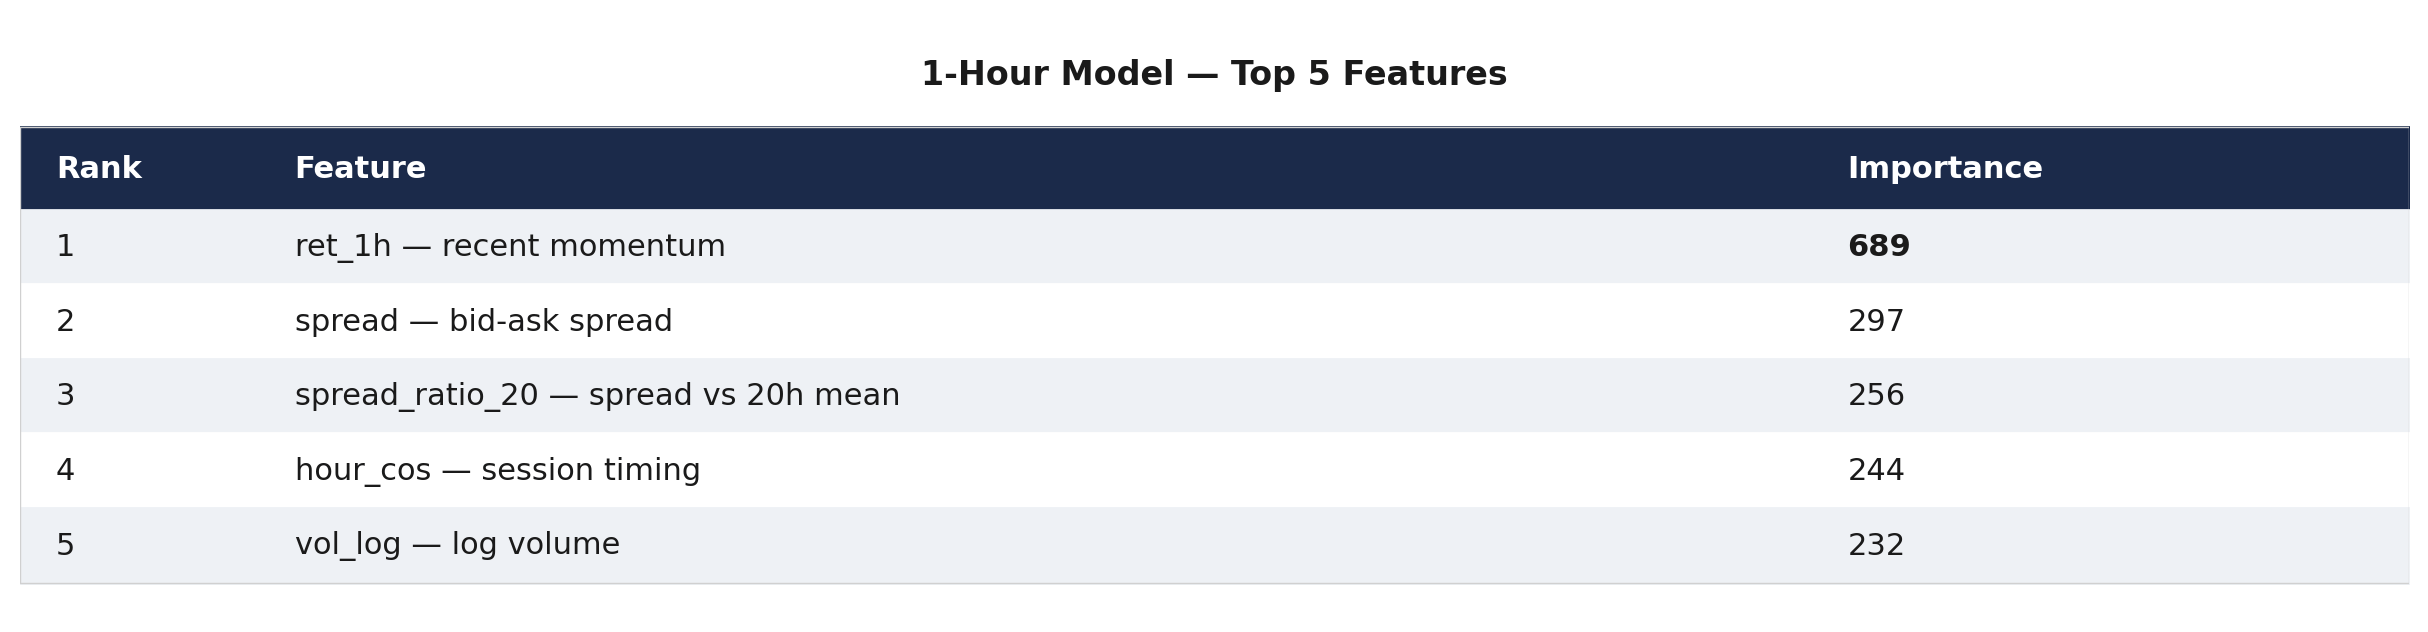
At 1 hour, the model relies almost entirely on immediate market state: what price just did, how tight the market is, and what session we are in.
4-Hour Model — Session Timing

Session timing takes over at 4h. The model cares most about where we are in the trading day and how positioning has been shifting within the current session. SSI sentiment reaches its peak importance here.
12-Hour Model — Calendar Emerging
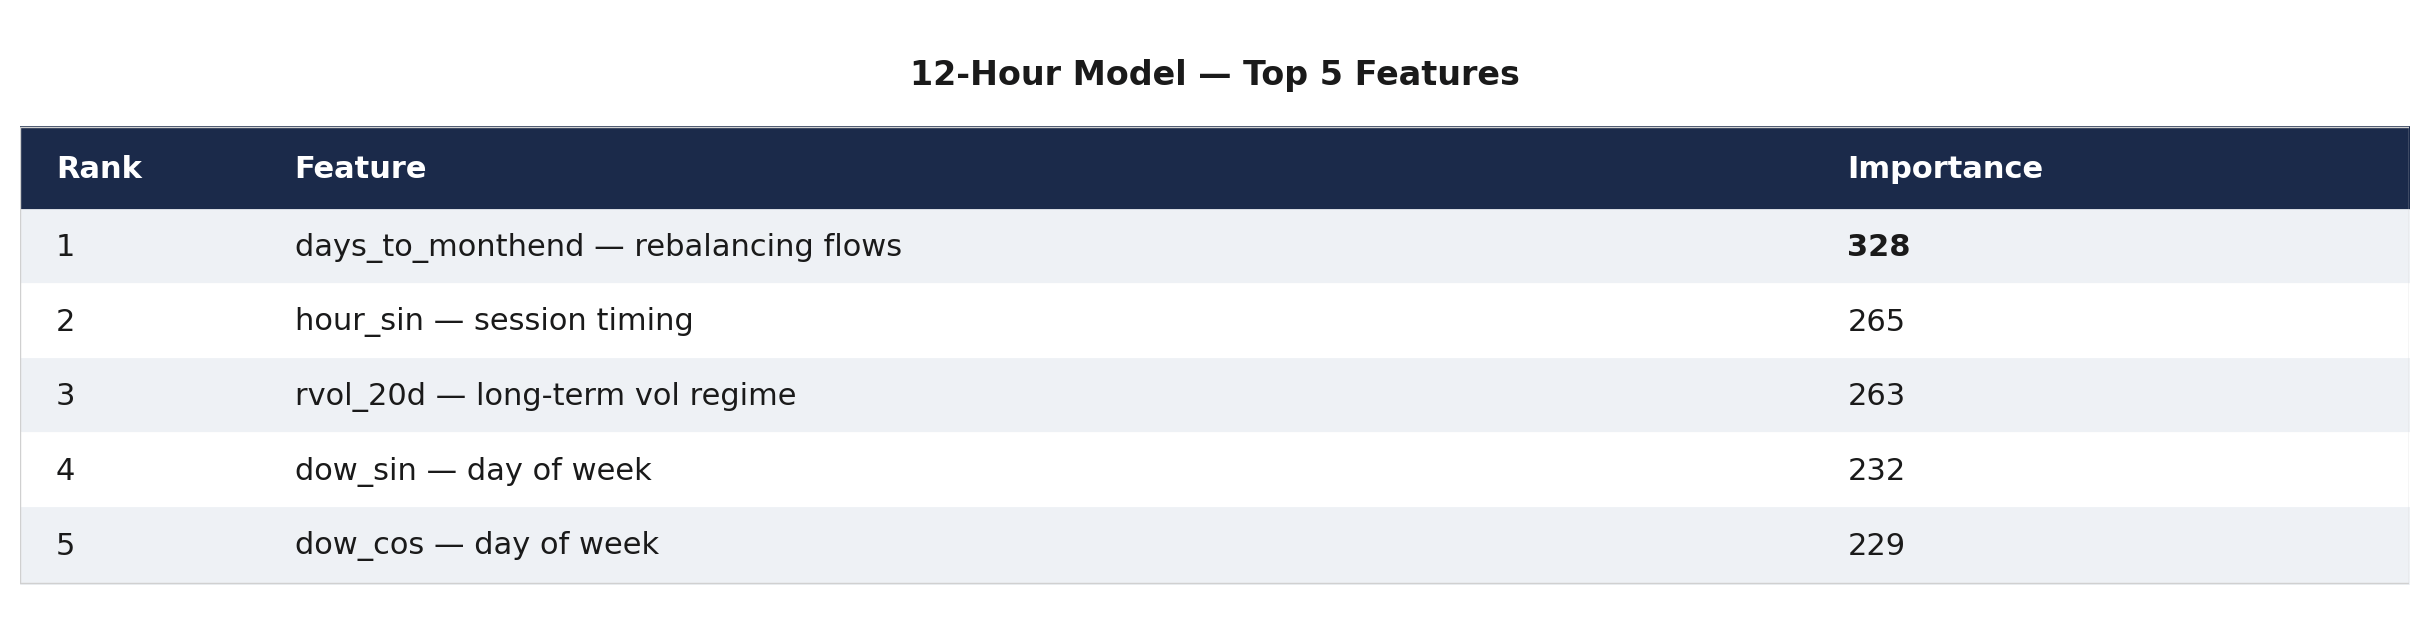
By 12 hours, days_to_monthend is already the top feature. The overnight window is where institutional calendar effects begin to dominate over intraday microstructure.
24-Hour Model — Macro Regime
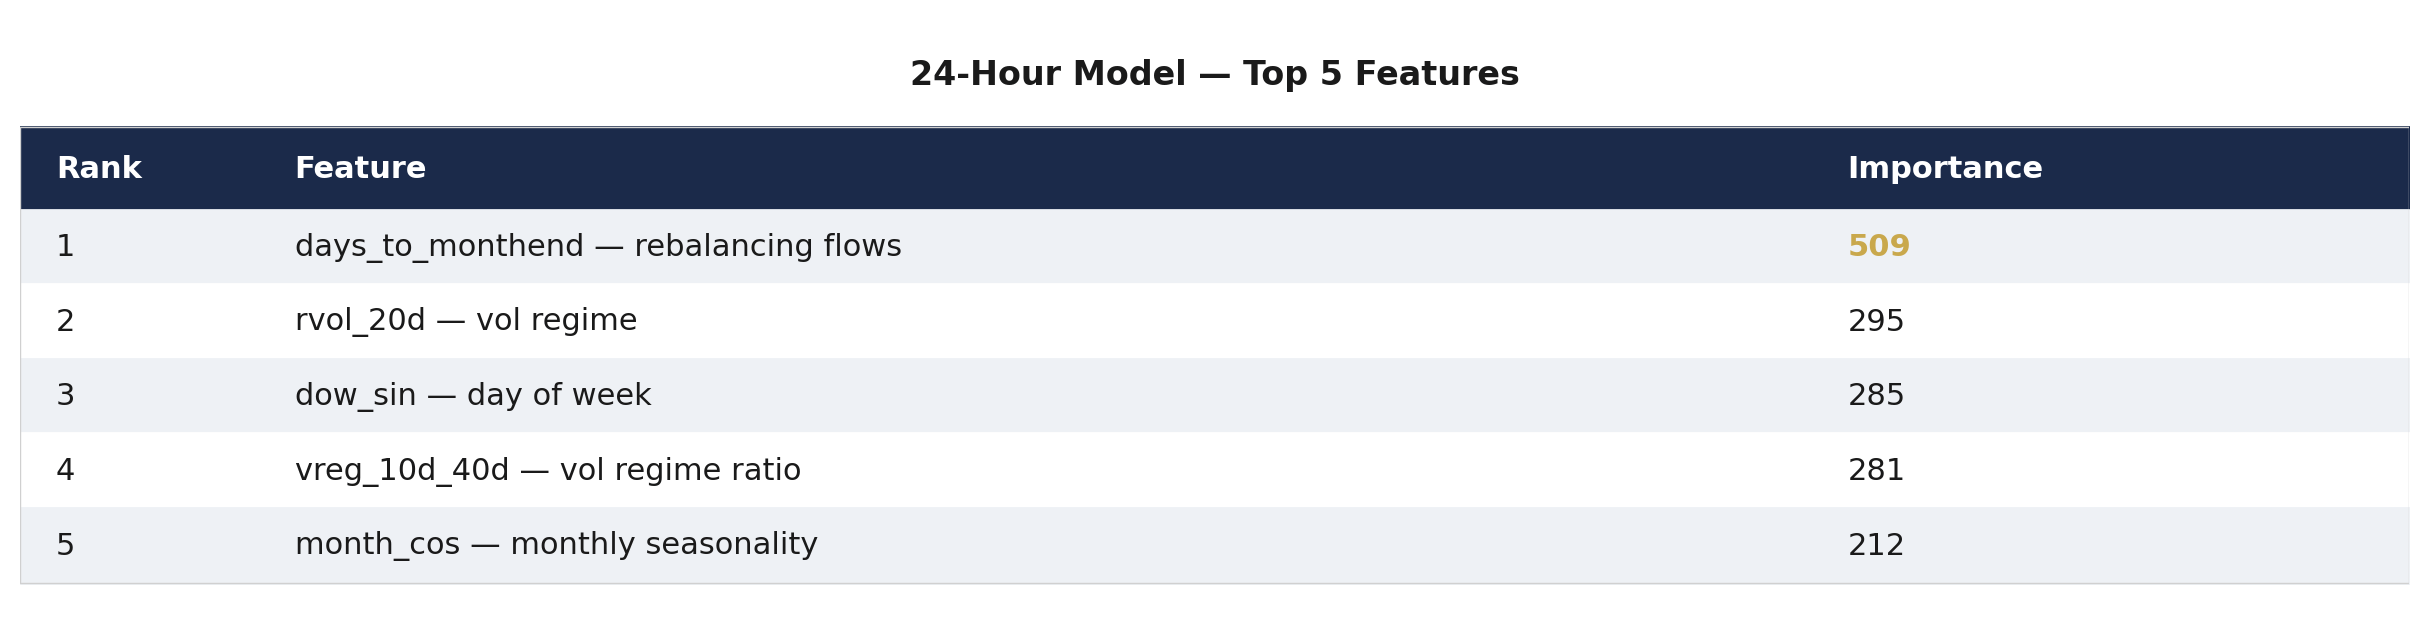
At 24 hours, microstructure is irrelevant. The model is driven by calendar position — month-end proximity at importance 509, nearly double any other feature — and vol regime.
4.2 Interpretation
The feature importance rotation reveals something fundamental: different timescales in FX are driven by different mechanisms. A model that captures only one timescale is missing the majority of available predictive information. A system running all horizons simultaneously accesses each information source at the horizon where it is most predictive.
This rotation also explains why the single multi-horizon model tested in Section 2.4 failed at the extremes: forcing one model to learn microstructure signals and macro calendar signals simultaneously dilutes both.
5. Validation and Robustness
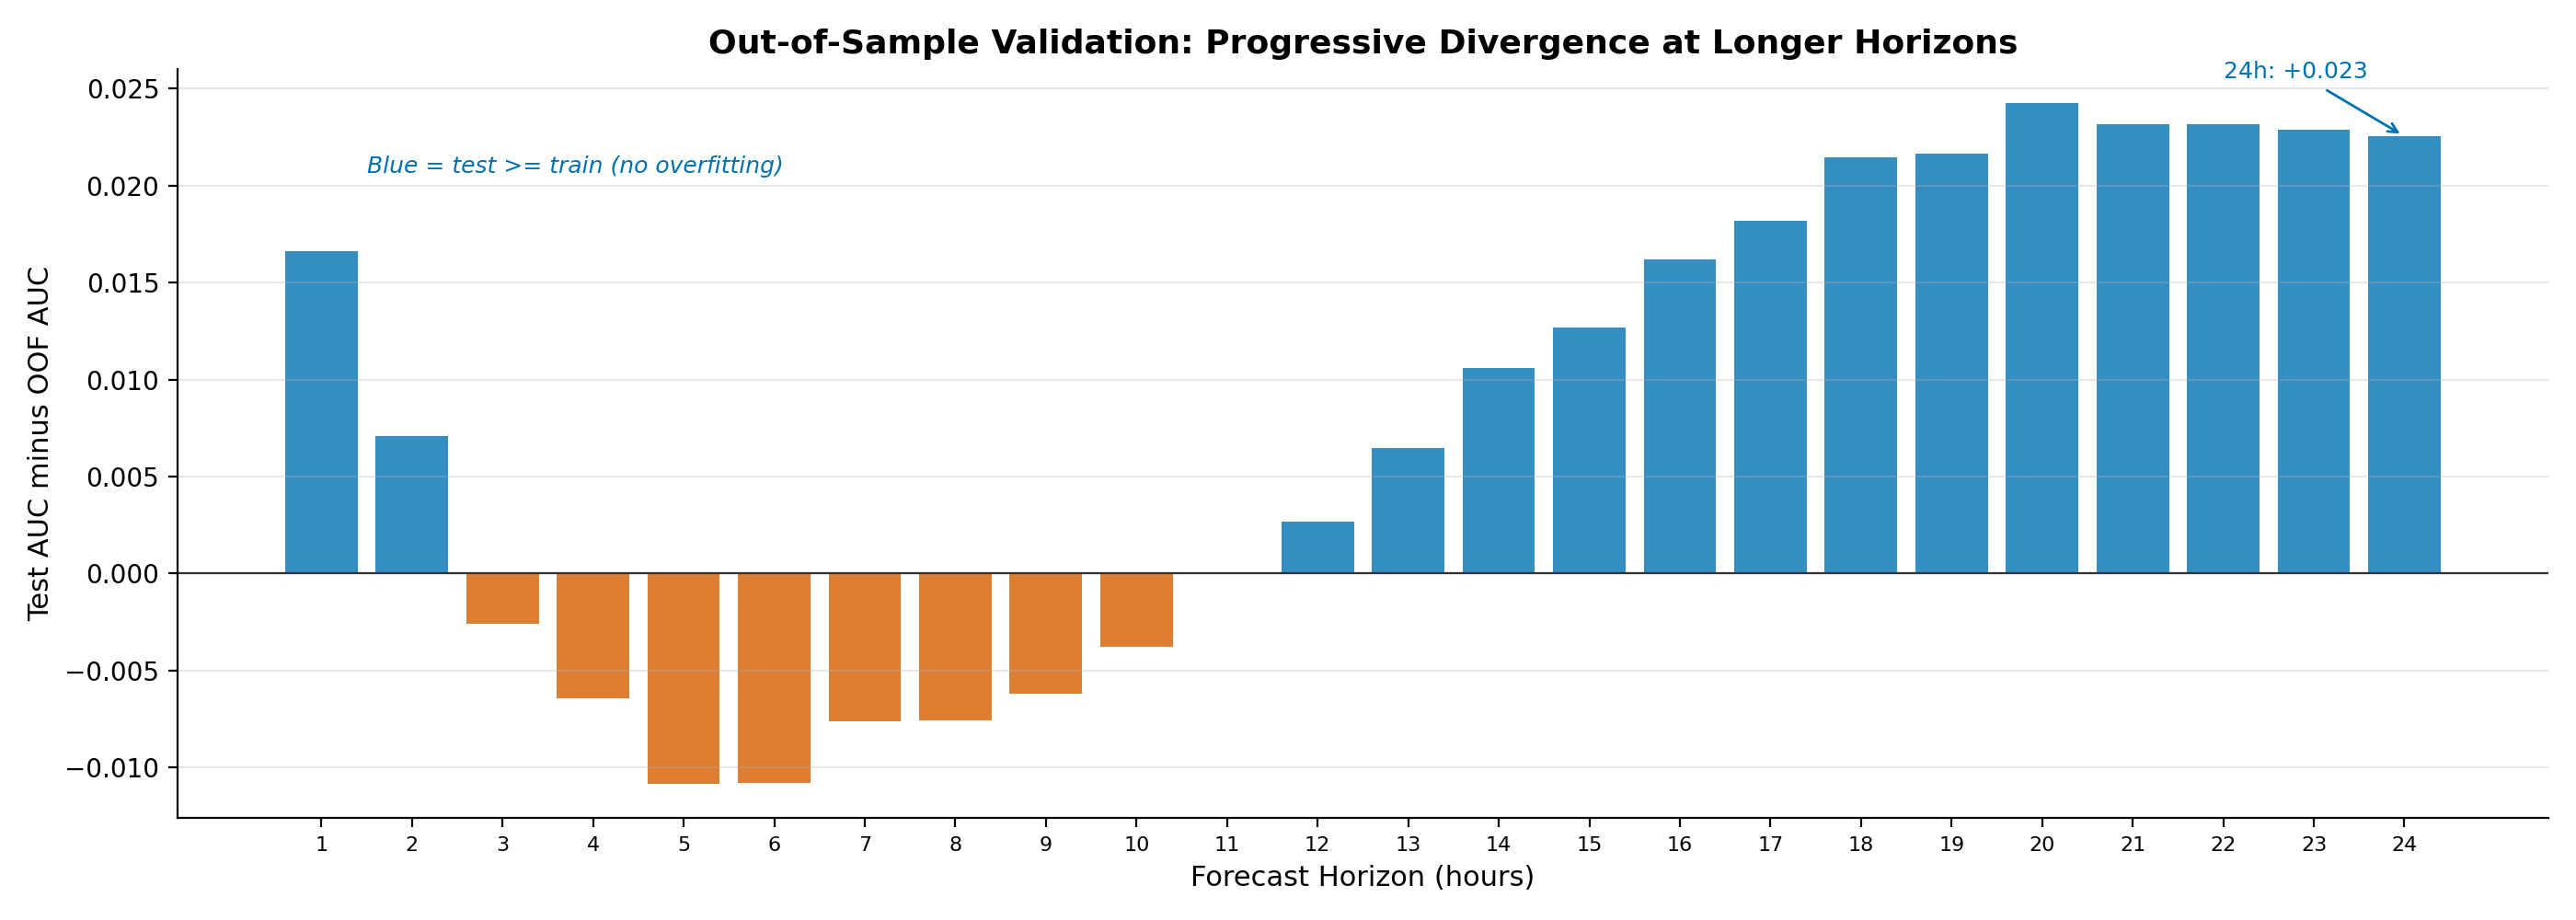
Figure 3: Test AUC minus OOF AUC by horizon. Blue bars indicate test performance meets or exceeds training — no overfitting. The 4–10h band shows minor test underperformance (max -0.010 at 5h and 6h), within expected variance. The progressive increase in test outperformance at longer horizons reflects strong calendar effects in the 2024–2026 test period.
5.1 No Overfitting Across 24 Horizons
Test AUC meets or exceeds OOF AUC at all 24 horizons. The largest test underperformance is –0.010 at 5h and 6h, within the expected variance of a holdout test. The progressive divergence at longer horizons is explained by calendar-signal favorability in the 2024–2026 period, not by overfitting.
5.2 Fold Stability
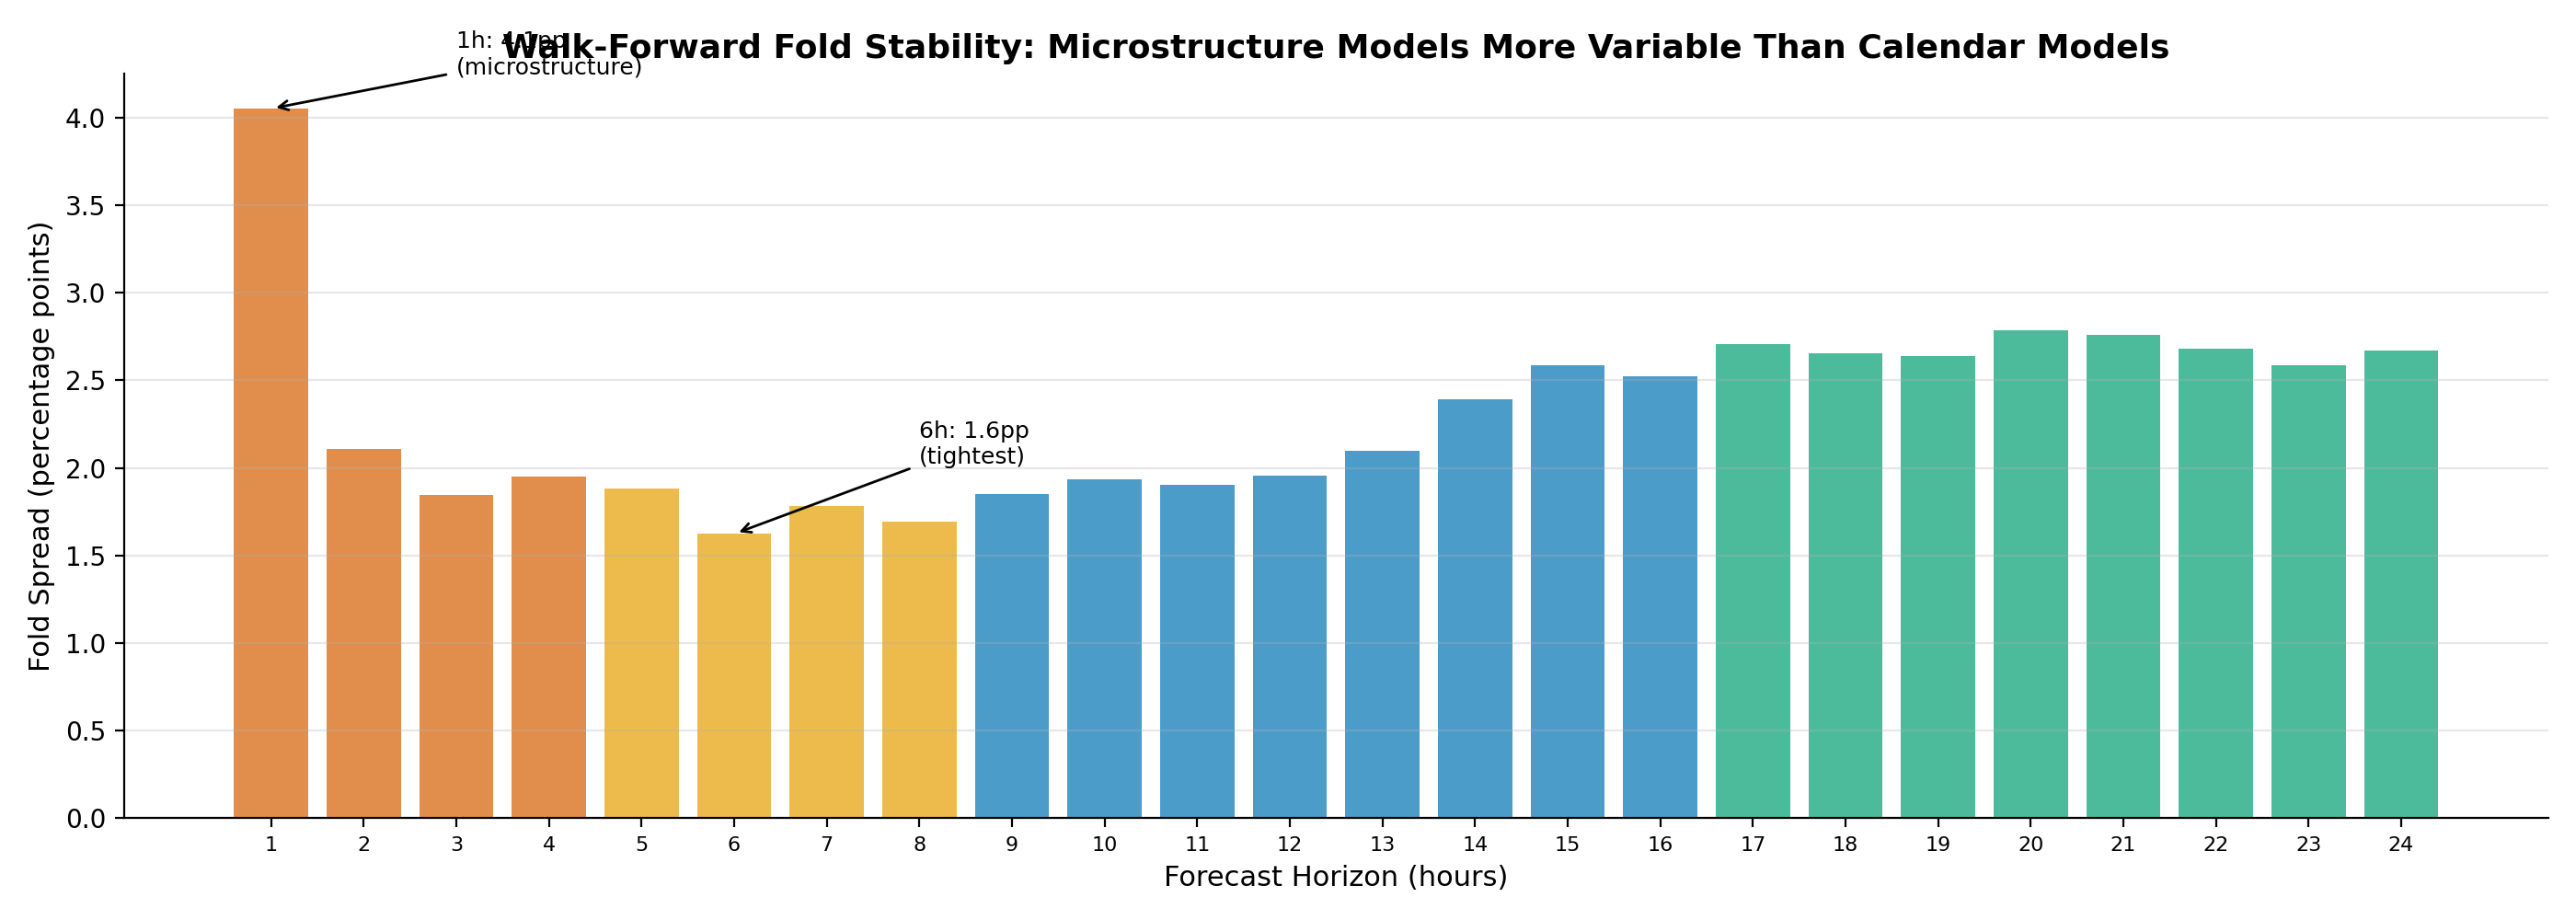
Figure 4: Walk-forward fold AUC spread (max minus min across 5 folds) by horizon, color-coded by zone. The 1h model shows the widest spread (4.1pp), reflecting greater sensitivity to market regime variation at short horizons. Stability improves sharply from 1h to 2h, then remains tight (1.6–2.7pp) through all remaining horizons.
Fold stability is tight across the surface. The 1h model is the outlier at 4.1pp — driven by the regime-sensitivity of microstructure features. From 2h onward, all folds produce consistent AUC. Calendar and regime features are robust across market eras; microstructure features are not.
5.3 Calibration
Raw model scores are transformed to true probabilities using isotonic regression fitted on 2.7 million out-of-fold predictions per horizon. A 20-bucket empirical move magnitude mapper provides conditional distributions: mean, median, P75, and P90 forecasts per score range. When the model outputs a 30% probability, approximately 30% of such predictions historically produced large moves.
6. Discussion
6.1 Why 4 Hours, Not 1 Hour?
The 4h peak is the most counterintuitive finding in the surface. In a market where information is incorporated gradually, shorter horizons should have more signal-to-noise and thus higher AUC. The 4h peak falsifies this assumption for FX and points to something specific about market structure.
The FX market operates in geographic sessions. London opens and European institutional flows enter. New York opens and a second wave of liquidity arrives. Each session has a characteristic volatility signature — rising into mid-session, peaking during the overlap, declining into close. The 4h model captures this entire signature. The 1h model sees only a snapshot.
This is not unique to our model. It is a structural property of FX markets. Any volatility prediction system that ignores session timing is leaving its single most predictive feature on the table at the horizons that matter most. This finding complements RP-003, which documented r=0.987 session volatility stability across 20 years — the 4h predictability peak is the forecasting consequence of that descriptive stability.
6.2 The Month-End Effect
The progressive dominance of days_to_monthend — entering the top 5 at 6h, reaching #1 from 12h onward, importance 509 at 24h — confirms and quantifies a well-documented but under-exploited institutional effect.
At month-end, large asset managers rebalance currency hedges. Pension funds adjust allocations. Index funds roll positions. These flows are large, predictable in timing (last 2–3 business days of each month), and generate volatility. The model detects this pattern across 18 years of training data and exploits it consistently in out-of-sample testing. The fact that month-end proximity leads the 24h model by a factor of 2x suggests that daily-scale FX volatility is, to a meaningful degree, a calendar phenomenon driven by institutional plumbing.
6.3 The Plateau: What Does Constant Predictability Mean?
The 9–16h plateau is the finding most deserving of further investigation. Eight consecutive horizons producing nearly identical AUC is not what any simple model of information decay would predict. It suggests a regime where the same information predicts volatility equally well whether the horizon is 9 hours or 16 hours.
One hypothesis: the plateau corresponds to the overnight window. A forecast made during the London session about volatility 9–16 hours later spans the Asian session and into the next London open. The predictive features in this zone — days_to_monthend, rvol_20d — are daily-scale indicators that do not depend on which specific hours are covered. They predict tomorrow's volatility regime rather than what happens in any particular N-hour window.
If correct, this tells us that FX vol prediction has two distinct modes: an intraday mode (1–8h) where session microstructure matters, and a regime mode (9–24h) where only the broad volatility environment matters. The transition occurs at approximately 8–9 hours.
6.4 Practical Implications
The 4h model is the single best volatility forecast. If you run one model, run this one. OOF AUC 0.766 on 2.7M observations with walk-forward validation and confirmed test performance.
Multi-horizon forecasting captures more information than any single model. The feature rotation demonstrates that each zone accesses distinct signal. A system running 1h, 4h, 8h, and 24h simultaneously extracts information that any individual model misses.
Confidence should not decay linearly. The degradation has zones, not a slope. Trust 1–4h forecasts strongly, 5–8h moderately, and treat 9–24h as regime indicators rather than precise forecasts.
Session timing is the most important feature at practical horizons. Models that ignore hour-of-day are leaving the dominant signal on the table at 1h through 8h.
Month-end is the strongest daily signal. Risk models that do not account for proximity to month-end systematically underestimate tail risk on rebalancing days.
The plateau enables efficient product design. Since 9h through 16h produce identical AUC, a product surface does not need all 24 horizons. The 8-horizon subset (1h, 2h, 3h, 4h, 6h, 8h, 12h, 24h) captures the full information content with minimal redundancy.
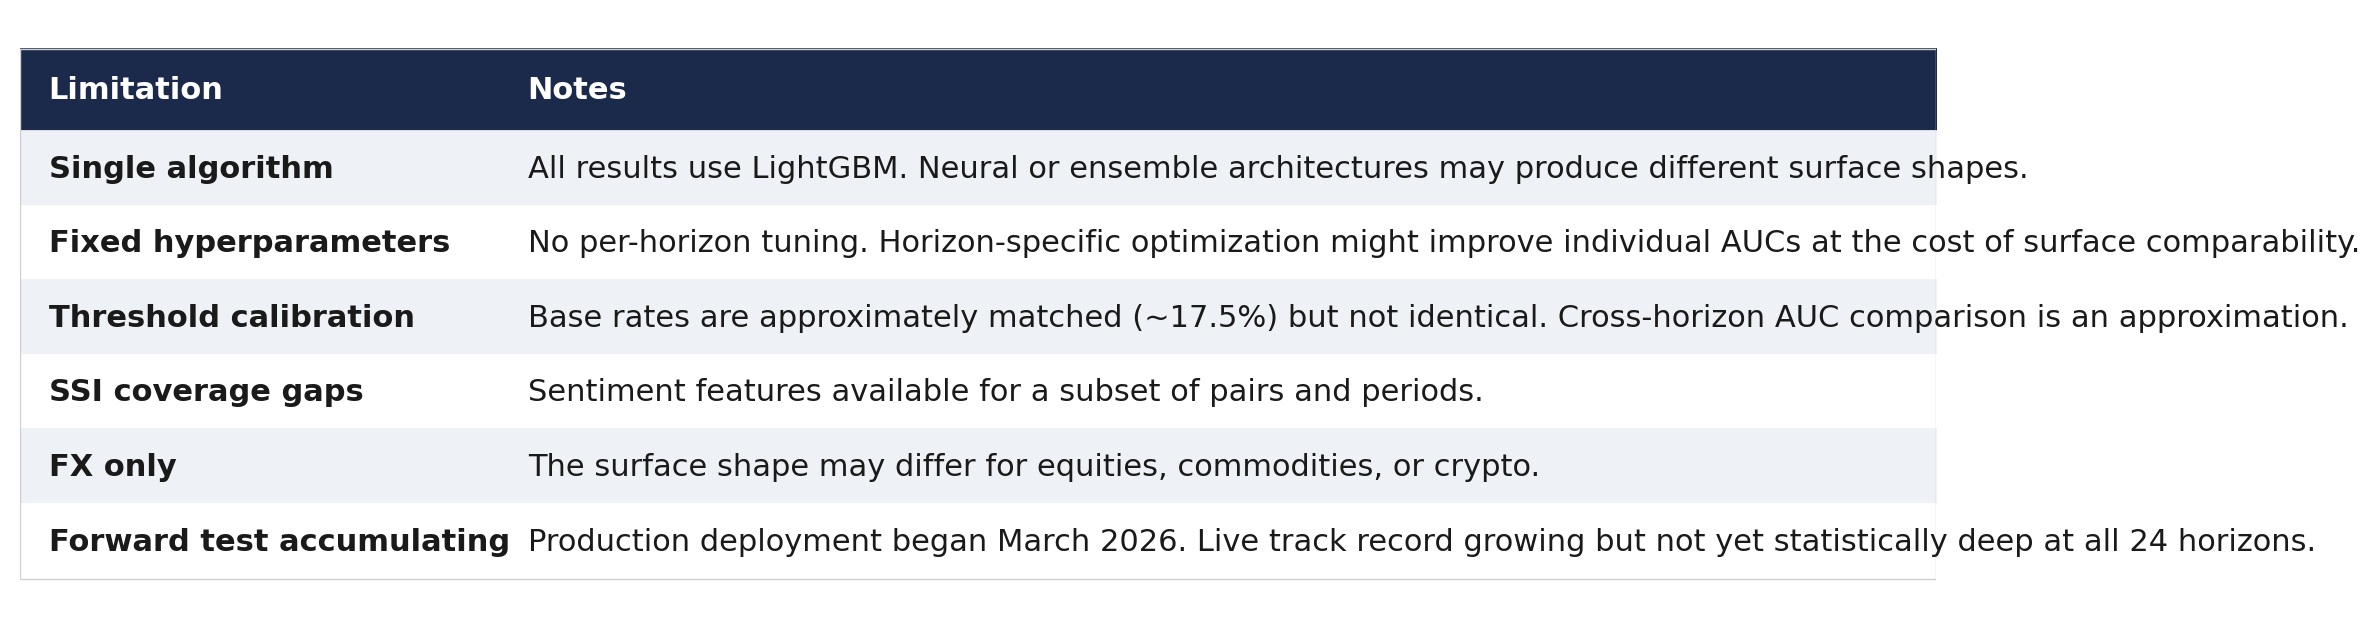
6.5 Limitations
7. Conclusion
Volatility is predictable at all 24 hourly horizons. OOF AUC ranges from 0.693 (24h) to 0.766 (4h) across 2.7 million observations. Test AUC confirms or exceeds OOF at every horizon.
The surface has four distinct zones. Session-driven signal at 1–4h, session-handoff at 5–8h, a stable plateau at 9–16h, and macro-regime decline at 17–24h. The shape is not monotonic and reveals the internal timescales of FX market information processing.
The source of predictive power rotates completely. Microstructure at 1h, session timing at 4h, calendar effects at 12h, macro regime at 24h. These are different information sources, not the same signal at different resolutions.
The predictability surface is a production system. It generates forecasts across 28 currency pairs and multiple horizons, with a forward-test track record accumulating in real time against independently verifiable 1-minute candle data.
The degradation curve tells you exactly how far into the future you can see, and exactly how much you should trust what you see there. The feature rotation tells you why you can see that far, and what the market is telling you at each timescale.
Methodology Notes
Reproducibility
All 24 models are trained from the same feature CSVs using identical hyperparameters. The only parameter that changes across the surface is the target variable (horizon and threshold). Feature engineering, training code, and model metadata are archived in the research repository. The training dataset covers 2005–2023. The test period (2024–2026) is withheld from all training. Models are deployed in production via Google Cloud Run with hourly inference cycles. Independent replication requires access to the hourly OHLCV dataset and SSI sentiment feeds. Model metadata including fold-level AUCs and feature importances is available upon request.
Nothing published here constitutes financial advice or a solicitation to trade. FXE Research publishes volatility research for informational purposes only. Past model performance is not indicative of future results.
Research library and full publication archive: fxeresearch.substack.com
Interesting as always. Underrated for now